What Is a “Clutch” Badminton Player? Analyzing Final vs Early-Round Win Rates
In a sport where a single rally can shift momentum and a 20-20 scoreline is routine, the word “clutch” carries real weight. But it also gets used loosely — applied to any player who happens to win a tight match, or denied to any star who once lost a Final. Our database of 14,918 BWF World Tour matches between 2018 and 2021 provides a more structured approach: two measurable proxies for clutch performance that separate genuine pressure performers from players whose reputations have gotten ahead of their data.
- BWF Finals go to three sets at a rate of 44.3% — significantly higher than the 34.9% average across all rounds.
- Clutch performance can be measured by two metrics: three-set win rate and Finals win rate relative to overall win rate.
- Kento Momota holds the highest three-set win rate in our MS dataset at 84.8% across 33 deciding-game situations.
- Anthony Ginting’s three-set win rate (54.5%) is nearly a coin flip — a notable gap from his 61.8% overall win rate.
- A player’s Finals win rate below 50% is a strong indicator of anti-clutch performance, but sample size must always be checked.
How “Clutch” Is Defined Using BWF Match and Round Data
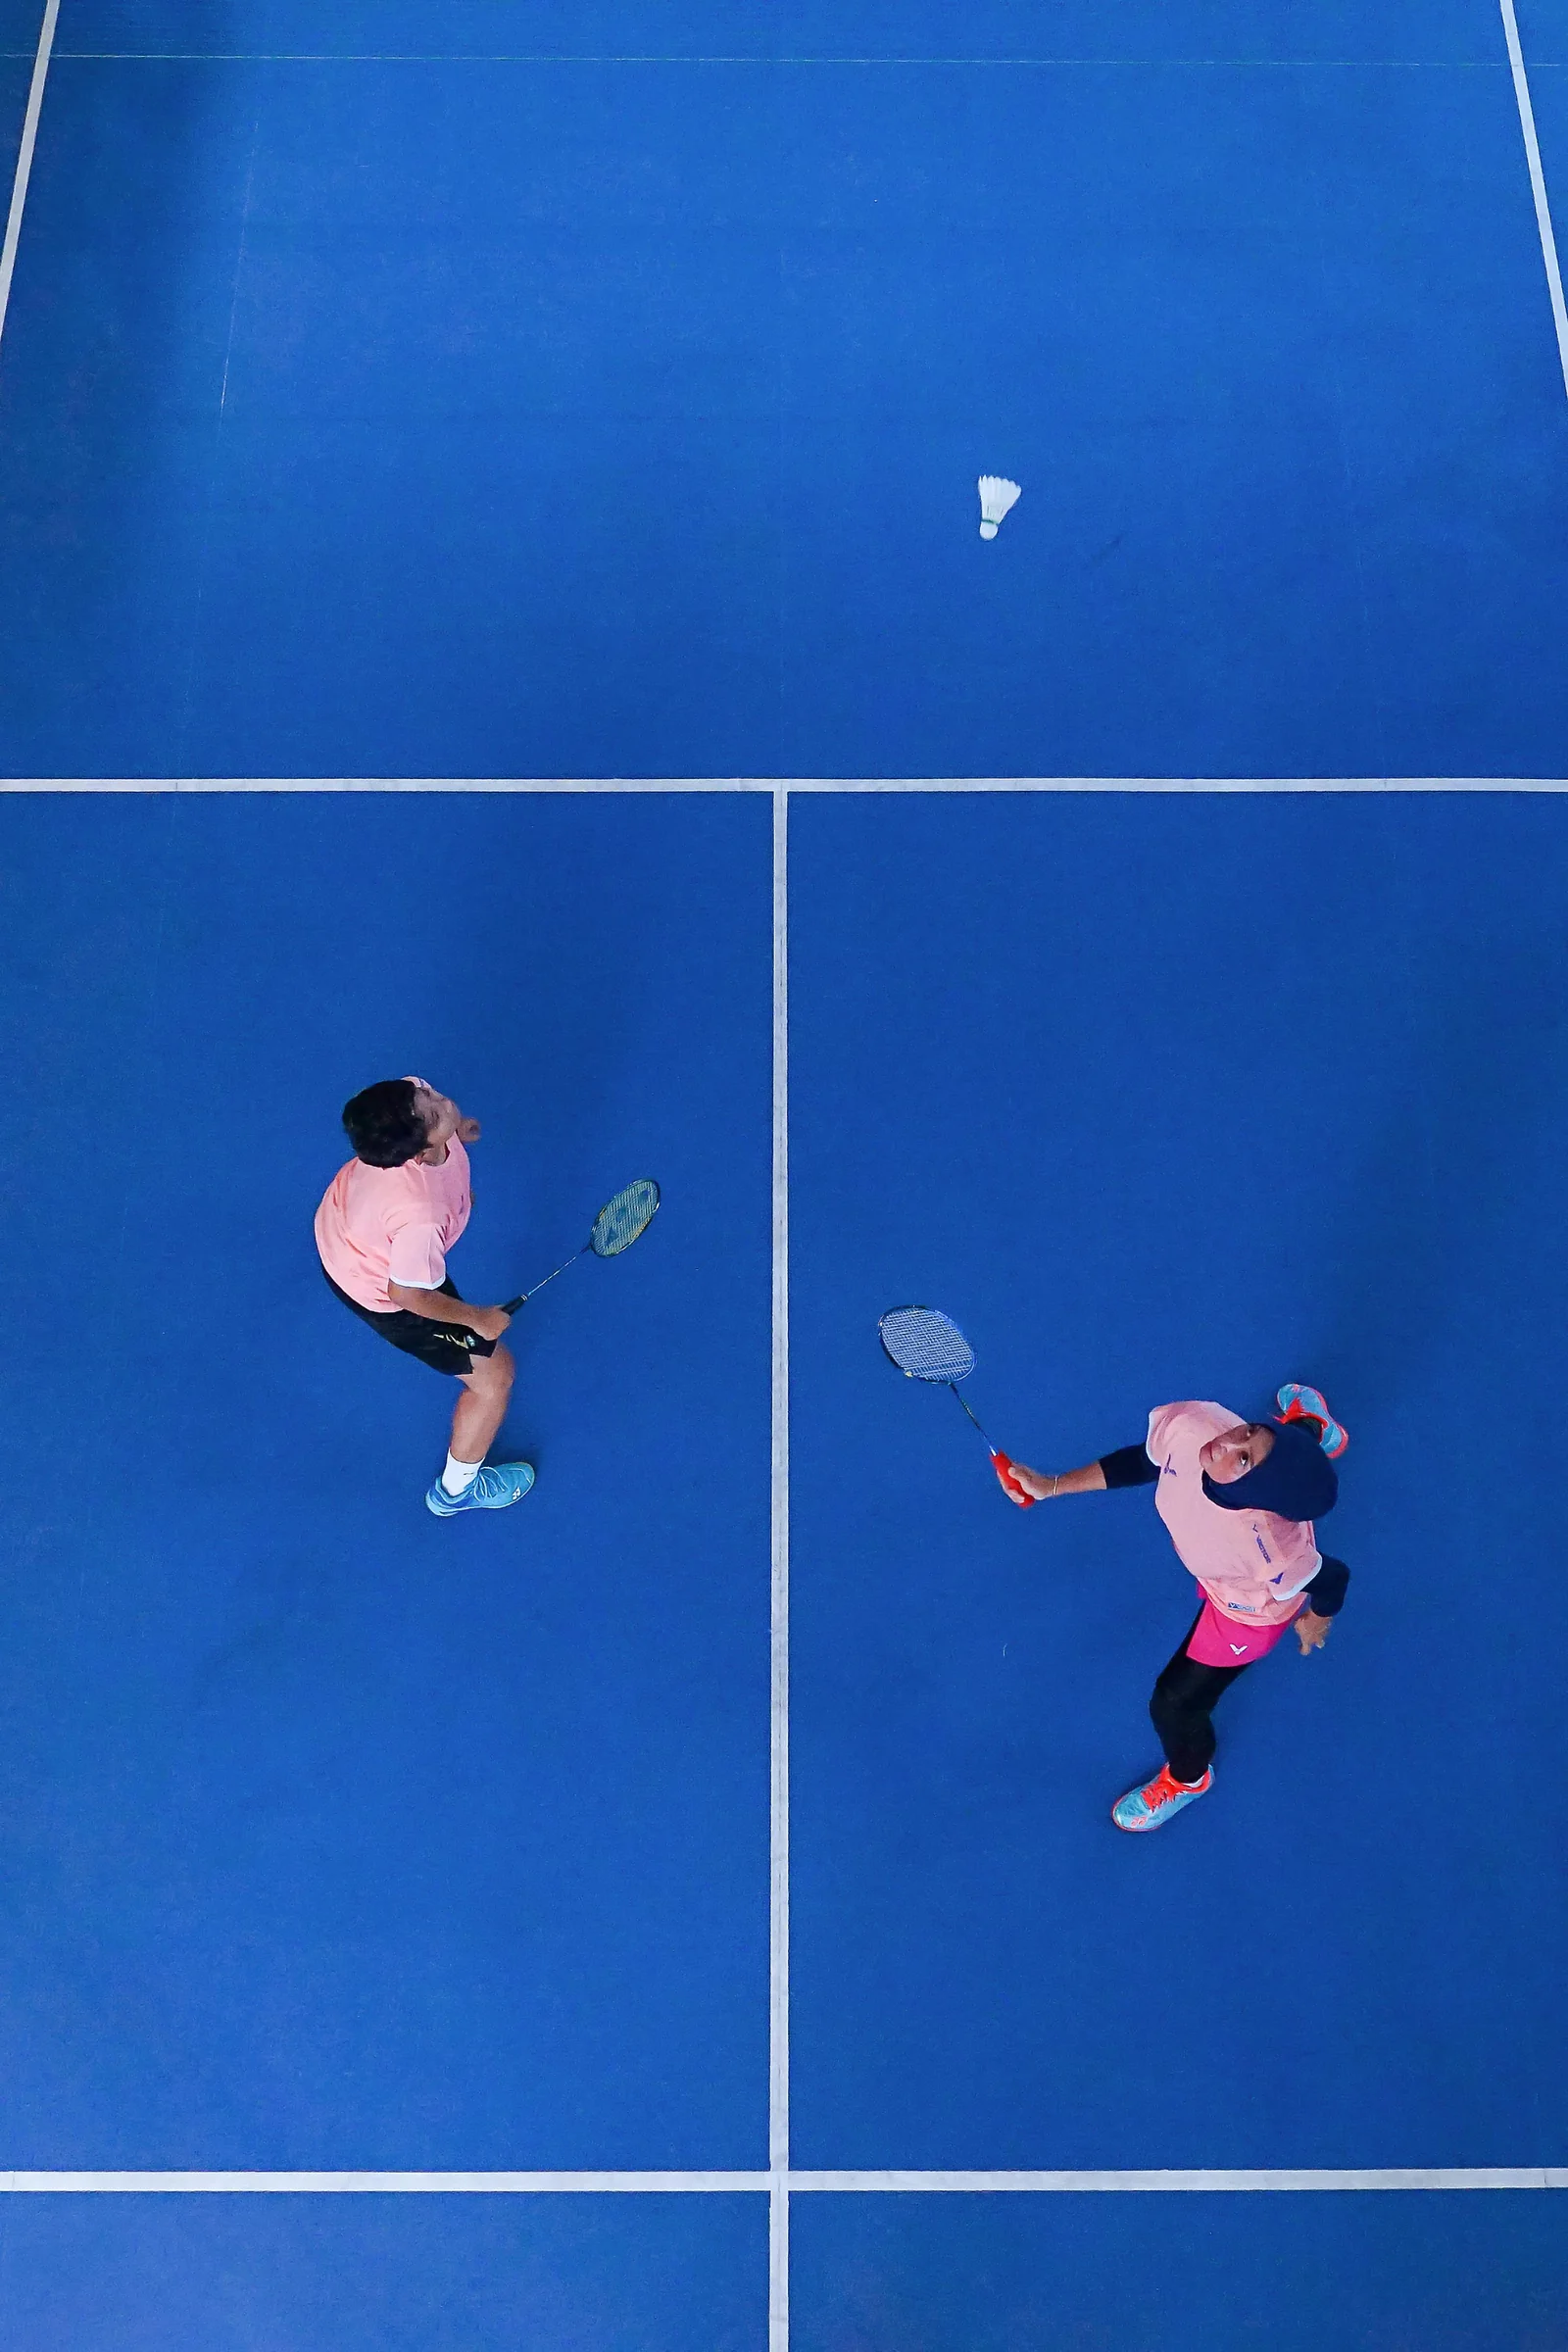
Clutch performance in badminton analytics is not a vague quality — it can be approximated by specific data points that exist in BWF match records. The challenge is isolating moments where the stakes are highest and then measuring how a player responds.
The Two Metrics That Measure Clutch Performance in Badminton
The first metric is the three-set win rate: a player’s record in matches that go to the deciding third game. When a match reaches the third set, both players have already split the first two — the outcome is maximally uncertain, and the player who performs best in that final set wins. Across all men’s singles matches in our database, 34.9% of matches required a third set (1,313 out of 3,761). That figure is our baseline: the frequency of deciding-game situations that any MS player faces across a career.
The second metric is the Finals win rate versus the player’s overall win rate — what we call the clutch gap. If a player wins 80% of their matches overall but only 60% of their Finals, the 20-percentage-point gap reflects an observable decline specifically at the highest-stakes round. If the gap is small or reversed (Finals win rate close to or above overall rate), the player’s performance is stable or elevated under maximum pressure. Both metrics are needed: a player can have a high Finals win rate from a small sample while performing poorly in three-set situations across hundreds of matches.
Why Finals Are the Highest-Pressure Rounds in the Draw
The data confirms that Finals are structurally more intense than any other round. In our BWF dataset, 44.3% of men’s singles Finals went to three sets (39 out of 88). Compare that to the 34.9% overall rate — Finals are 27% more likely to require a deciding game. The opponent quality in a Final is also maximally concentrated: both players have won every match in the draw to reach that point, meaning the field has self-selected to the two strongest performers of the week. A player’s Finals win rate is measured against opponents who, by definition, also know how to win under pressure.
This structural context is why the Finals win rate carries more weight than a win rate at any earlier round. Reaching the Final is table stakes; winning the Final is where clutch separates from merely competent. Understanding how round performance breakdowns work gives you the broader framework to situate Finals data within a player’s full stage profile.
The Clutch Gap: What Happens to Win Rate When It Matters Most
The clutch gap is calculated by subtracting a player’s Finals win rate from their overall win rate. A positive clutch gap means a player performs worse at Finals than their average record would predict. A negative or near-zero clutch gap means the player performs consistently — or even better — at the highest stage.
Kento Momota illustrates the benchmark: his overall win rate is 86.6% and his Finals win rate is 77.8%, giving a clutch gap of 8.8 percentage points — tight for a player at that level. Viktor Axelsen’s overall rate is 77.3% versus a Finals rate of 61.5%, a gap of 15.8pp. Anthony Ginting’s gap is more extreme: 61.8% overall, 37.5% Finals, a 24.3-point difference. The clutch gap alone tells you whether a player’s headline win rate is a reliable guide to their performance when it most counts.
Real Examples: Clutch and Anti-Clutch Players in the BWF Data

The data produces a clear spectrum from consistently clutch to reliably anti-clutch, with most players occupying the middle range. Three cases illustrate the extremes and the nuanced middle.
Kento Momota: The Defining Clutch Standard in Men’s Singles
Momota’s three-set win rate of 84.8% across 33 deciding-game matches is the highest in our MS dataset among players with at least 8 such appearances. His 28 wins from 33 third-set matches means that when the match went to maximum tension — both players having split the first two games — Momota won nearly 6 in every 7. Combined with a Finals win rate of 77.8% across 18 Final appearances (14 wins), he is the most reliable measurable clutch performer in the men’s singles data.
What makes this figure more compelling is its context. His three-set win rate (84.8%) is only 1.8 percentage points below his overall win rate (86.6%) — he performs almost identically whether the match is one-sided or going the full distance. This is the defining marker of a genuinely clutch player: their performance does not degrade when the margin of error shrinks. His head-to-head record in Finals reinforces this — he rarely gave opponents a path back once reaching the deciding match.
Anthony Ginting vs. Anders Antonsen: Two Paths Under Pressure
Anthony Ginting and Anders Antonsen each had three titles in our dataset and comparable amounts of tour experience, but their clutch profiles diverge sharply. Ginting’s three-set win rate is 54.5% across 44 deciding-game matches — barely above a coin flip. His overall win rate of 61.8% means a significant portion of his wins come in straight sets against weaker opponents; when pressed to a third game, his advantage shrinks to near-nothing. His 37.5% Finals win rate (3 wins from 8 Finals) is consistent with this pattern.
Antonsen’s three-set win rate is 66.7% — 12 percentage points above Ginting’s — across 33 deciding-game matches. This 22/33 record places him clearly above the coin-flip baseline and shows a player who, while not matching Momota’s benchmark, measurably improves relative to opponents in maximum-pressure matches. His 50% Finals conversion (3 wins from 6 Finals) is correspondingly higher. When two similarly ranked players meet in a late round, the three-set win rates should be part of any comparative analysis.
Tien Chen Chou and the “Good But Not Clutch” Zone
Tien Chen Chou (Chinese Taipei) occupies the analytically interesting middle ground. His three-set win rate is 62.1% across 58 deciding-game matches — a large sample that makes this figure meaningful. He wins more than he loses in deciding games, which is above average, but the gap from Momota’s 84.8% is significant. His Finals record of 50.0% (6 wins from 12 Finals) is the arithmetic median: he wins exactly as many Finals as he loses.
Chou is a legitimate elite player by every measure — 6 titles, 12 Finals appearances, 72.2% overall win rate — but the data does not support classifying him as clutch in the same sense as Momota. He is consistent under pressure rather than elevated by it. The distinction matters when predicting outcomes in Finals: Chou in a Final is a genuine 50/50 against another top-8 player, which is itself a form of consistency, but it is not the same as a player whose win rate actually rises in that context.
How to Spot Clutch Players Before a Final
Clutch is a predictive concept as much as a descriptive one. Three practices make the data useful in advance of a specific Final rather than only as a historical summary.
Comparing 3-Set Win Rate Across Tournament Levels
A three-set win rate accumulated primarily at Super 100 and Super 300 events is a different signal from the same rate at Super 750 and Super 1000 events. At the lower tier, a top-30 seed can reach the quarterfinal without encountering a player ranked above 50, meaning their third-set wins come against lower-quality opposition. Before treating a high three-set win rate as a clutch indicator, check whether those matches came at the tour’s highest tier or primarily at weaker fields. Momota’s 84.8% rate includes substantial data from Super 1000 events; a player with a similar rate built at Super 100s is claiming a weaker credential.
Finals History as a Predictor, Not a Guarantee
A player’s Finals win rate tells you how they have historically performed in the highest-stakes match of a tournament — but it does not tell you about the specific opponent in the next Final. Clutch performance is always measured against someone. Momota’s 77.8% Finals rate was built against different opponents on different surfaces in different conditions. What the rate captures is a consistent ability to out-perform opponents who also reached the Final, which is the best available proxy for future Finals performance.
Use the Finals win rate as a prior probability, then adjust based on what you know about the specific matchup — the opponent’s own Finals win rate, recent form, and head-to-head record in late-round encounters specifically.
Why Sample Size Limits Every Clutch Claim
A minimum of 8 Final appearances is needed before a Finals win rate becomes reliable. Below that threshold, a single result shifts the rate by more than 12 percentage points. In our dataset, several players carry perfect 100% Finals records across 2 or 3 appearances — these are genuine achievements but carry almost no predictive weight. Similarly, a three-set win rate from fewer than 8 matches should be treated as directional only.
The practical implication: when a commentator or analyst calls a player “clutch” based on one or two big moments, the label may be accurate as a description of those specific moments but is not yet supported as a stable, measurable quality. Reserve confident clutch classifications for players with at least 8 Finals appearances and 15+ three-set matches in their record — thresholds that Momota, Axelsen, Tien Chen Chou, and Ginting all exceed in our dataset.
Frequently Asked Questions
What is the rule of 30 in badminton?
At 29-29 in any game of a BWF match, the next point wins the game outright — this is informally called the rule of 30. It is the most extreme form of clutch situation in badminton: both players have saved match points and the next single point is decisive. Players with high three-set win rates tend to perform well in these scenarios because they are already comfortable with maximum-pressure play.
How do you measure clutch performance in badminton analytics?
The two primary metrics are three-set win rate (win rate in matches that go to a deciding third game) and the clutch gap (overall win rate minus Finals win rate). A three-set win rate above 65% with at least 15 matches qualifies as meaningfully clutch. A clutch gap below 10 percentage points indicates consistent performance regardless of match stakes.
Which BWF player has the highest three-set win rate?
In our database of 14,918 BWF World Tour matches from 2018 to 2021, Kento Momota holds the highest three-set win rate among men’s singles players with at least 8 deciding-game appearances, at 84.8% (28 wins from 33 three-set matches). This is 34.8 percentage points above the coin-flip baseline and reflects sustained clutch performance across multiple tournament tiers.